Statistics Canada's April 2026 payroll survey shows wage growth, sector contractions, and vacancy shifts

Canada's payroll employment edged upward in April 2026, but the figure obscures a labour market fracturing along sector and regional lines, according to new data from Statistics Canada.
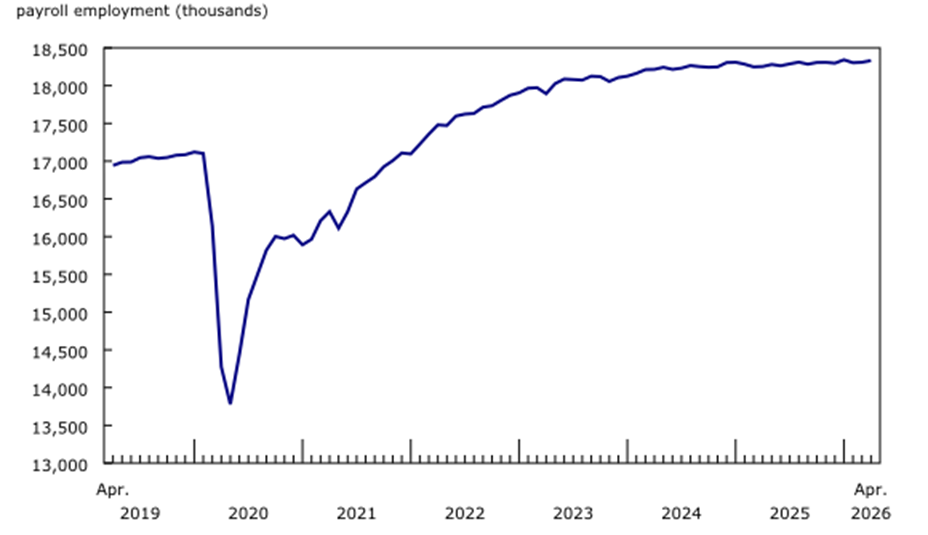
Statistics Canada's Survey of Employment, Payrolls and Hours (SEPH), released June 25, 2026, recorded a net gain of 22,000 payroll employees (+0.1 per cent) in April, following near-flat movement in March (+5,700; +0.0 per cent). Year over year, payroll employment was up 78,100 (+0.4 per cent).
The SEPH counts employees receiving pay and benefits from their employer — excluding the self-employed and agricultural workers — making it a precise gauge of formal, employer-driven labour demand. While Statistics Canada's Labour Force Survey reported a strong rebound of 88,000 jobs in May 2026, April's payroll data tells a more granular story about where employers are adding and cutting headcount, and what compensation pressures are building beneath the surface.
Wage growth is outpacing compensation benchmarks
A notable finding in the April 2026 SEPH is the acceleration in average weekly earnings. At $1,346 nationally, earnings were up one per cent from March and 3.8 per cent year over year — a pick-up from the 3.5 per cent growth recorded in March 2026. Average weekly hours held steady at 33.5, confirming the gain reflects genuine wage movement rather than longer hours.
Provincial variation sharpens the challenge considerably. Alberta led major provinces at $1,394.29 in April, Ontario posted $1,381.76 (+4.1 per cent year over year) and British Columbia $1,357.68 (+3.8 per cent). Atlantic provinces saw steeper growth rates: New Brunswick up 6.7 per cent to $1,256.45 and Nova Scotia up 5.9 per cent to $1,221.52, according to Statistics Canada. The spread between Prince Edward Island ($1,161.80) and Alberta ($1,394.29) exceeds $232 per week.
For HR executives managing compensation and benefits strategies across multiple provinces, that gap has direct implications for pay equity analysis, internal mobility, and retention risk. Salary bands anchored to 2025 data may already be structurally behind market.
Health care grows; tech contracts sharply
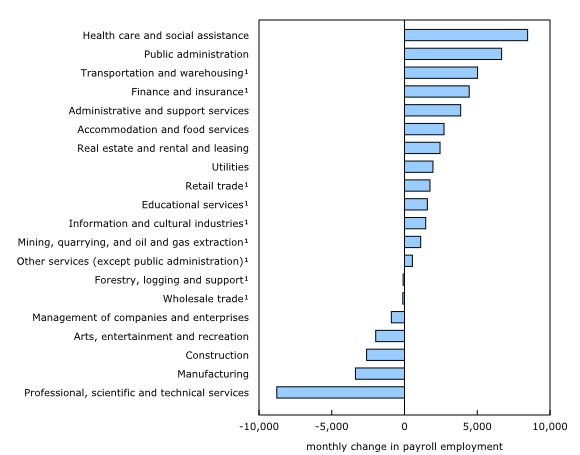
Health care and social assistance added 8,500 payroll employees (+0.3 per cent) in April, extending cumulative growth of 49,700 (plus two per cent) since September 2025, according to Statistics Canada. That sustained expansion reached across 14 of 18 sub-industries, led by general medical and surgical hospitals, child day-care services and community care facilities for the elderly. For talent acquisition teams in health care, this is a long-cycle demand signal requiring sustained recruitment pipelines, not a short-term surge.
Public administration added 6,700 workers (+0.5 per cent) in April — continuing a two-month run of gains — though federal government public administration was the lone sub-sector to decline year over year (-5,100; -1.3 per cent).
The most urgent signal sits in professional, scientific and technical services, where payroll employment fell 8,800 (-0.7 per cent) in April, extending a cumulative loss of 9,500 (-0.8 per cent) since February 2026. Computer systems design and related services accounted for 80.6 per cent of that sector-wide decline, shedding 7,600 employees (minus two per cent) over the period. Prior to February 2026, the sector had recorded little net variation for six months.
Manufacturing shed 3,400 payroll employees (-0.2 per cent) in April and was down 15,500 (minus one per cent) year over year, led by declines in transportation equipment and food manufacturing. Construction fell for a third consecutive month (-2,600; -0.2 per cent), bringing cumulative losses since February 2026 to 9,500 (-0.8 per cent) — though the sector remained up 10,800 (+0.9 per cent) year over year, according to StatCan.
Job vacancies plateau but the mix is shifting
Canada recorded 490,500 job vacancies in April 2026 — the fourth consecutive month of negligible movement — with the national vacancy rate at 2.7 per cent and 3.2 unemployed Canadians for every open role, the latter up from 3.1 in March 2026, according to StatCan. The year-over-year decline of 17,500 (-3.4 per cent) is far smaller than the 79,400 (-13.5 per cent) drop recorded between April 2024 and April 2025, suggesting the vacancy market is stabilizing.
Provincial variation remains pronounced. The Northwest Territories posted a vacancy rate of 5.4 per cent, Yukon 3.4 per cent and British Columbia 3.3 per cent, while Ontario recorded the lowest rate among provinces at 2.4 per cent and Newfoundland and Labrador the highest unemployment-to-vacancy ratio at 6.1.
Sector-level vacancy movements add a forward indicator. Professional, scientific and technical services posted its first monthly vacancy decline since February 2024 (-3,300; -9.4 per cent), while administrative and support services (-3,200; -12.8 per cent) and construction (-3,500; -10 per cent) also contracted. The sole sector to post a vacancy increase was retail trade (+6,000; +11.9 per cent), recovering most of March's losses. Year over year, retail trade vacancies were up 15.1 per cent and wholesale trade up 13.7 per cent. For HR leaders tracking sector-specific hiring demand across Canada, the divergence between contracting professional services and expanding retail signals how differently the labour market is moving in various sectors.