The numbers look great, but is there a concerning trend in them?

The August jobs report looked like a step in the right direction. U.S. employers added 162,000 jobs, nearly three times the 53,000 that economists surveyed by Dow Jones had forecast, according to CNBC, and the unemployment rate held steady at 4.1%. June and July's weak initial prints were revised up by a combined 55,000 jobs.
"Wow. A huge August jobs report," Heather Long, chief economist at Navy Federal Credit Union, wrote in a widely shared post reacting to the numbers.
It's easy to see why. Food service and hospitality businesses added 59,000 jobs, nearly five times their pace over the prior year. Local government education added 42,000, largely reversing a dip the month before. Manufacturing has now added 58,000 jobs since a low point last December, and Long pointed to solid hiring in manufacturing and construction, which she linked in part to AI-related data-center construction.
Chris Rupkey, chief economist at Fwdbonds, put it plainly: the labor market is "alive and well."
But sit with the occupational detail in the same report, and a second, quieter story starts to surface - one that HR and talent leaders overseeing white-collar workforces should not skip past.
The report is actually two surveys, one pattern
The monthly jobs report is actually two separate surveys stitched together: one asks businesses about payrolls, the other asks households about who's working and who isn't. This month, both are pointing in the same direction on one specific group: professional and management workers.
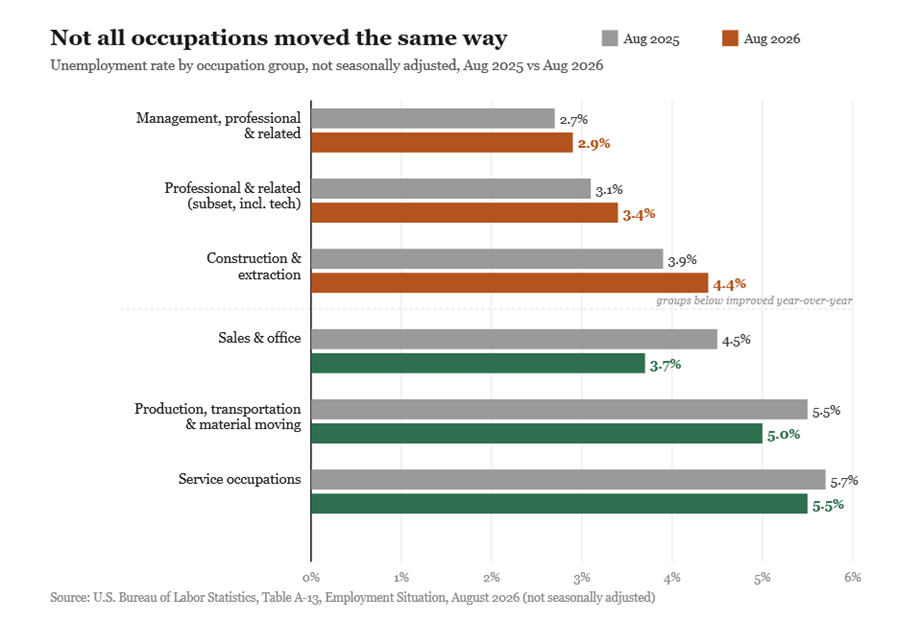
In the household survey, the unemployment rate for people in "management, professional, and related occupations" rose year-over-year, from 2.7% to 2.9%. Within that group, "professional and related occupations" specifically - a category that includes much office, analytical, and technical work, saw its jobless rate climb from 3.1% to 3.4%. That's a small move in absolute terms, but it stands out against most of the rest of the table: sales and office occupations improved sharply, from 4.5% to 3.7%, and production, transportation, and material-moving occupations improved too. (Construction and extraction occupations also ticked up, from 3.9% to 4.4% - a reminder this isn't a purely white-collar story, though it lines up with the professional-occupation trend more than it complicates it.)
Meanwhile, in the business survey, the information sector, which covers software, data processing, web hosting, publishing, and broadcasting, cut 23,000 jobs in August, a faster pace of loss than its own 12-month average. Professional and business services, historically one of the more reliable engines of white-collar hiring, was essentially flat for the month.
This isn't the first time HRD America has gone looking for an AI fingerprint in the labor data. In June, reporting on whether the "AI jobs apocalypse" was showing up in the numbers found the opposite of what many expected: former BLS Commissioner Erika McEntarfer said joblessness at the time appeared to be rising faster among workers in occupations least exposed to AI, not most, and that software developers, the textbook example of an AI-exposed role, had kept adding jobs.
"I find facts are a lovely reality check on vibes," she said.
August's data doesn't overturn that finding so much as narrow it. Software development work sits inside "professional and related occupations," the same bucket where BLS now shows unemployment ticking up. It's possible the picture McEntarfer described in the spring has started to shift as 2026 has worn on - or it's possible this is simply one month of noisy data in a category that moves around from survey to survey. One month's occupational detail, even a striking one, isn't a trend line. It is, however, a reason to watch the next two or three releases closely rather than write the question off.
It's also worth being honest about what the government data can and can't say. The BLS report does not ask employers why they cut a position, and nothing in it uses the word "AI." The information-sector losses and the uptick in professional unemployment are consistent with an AI-driven story - new hiring being deferred, tasks being absorbed rather than backfilled, entry-level pipelines quietly narrowing. But they're also consistent with plainer explanations: elevated interest rates raising the cost of capital for tech firms, a broader digestion period after 2023-2025's hiring boom, or normal monthly noise in a data series that gets revised for months after release. Anyone telling you the August numbers prove an AI jobs effect is overstating what a single month of occupational data can show.
The rest of the labor market isn't cracking
It's important to note what this isn't: a broad unraveling. The U-6 measure — the government's broadest gauge of labor market slack, capturing the unemployed, discouraged workers, and people stuck in part-time jobs who want full-time work — fell to 7.7% in August, its lowest level since at least April and down from 8.1% a year earlier. Long-term unemployment, at 1.9 million people, is essentially unchanged. If the labor market were deteriorating broadly, both of those measures would typically be moving the other way.
That combination of overall slack easing while one specific, white-collar-heavy corner of the occupational data gets a little worse is exactly what a targeted disruption would look like in the aggregate numbers, rather than a recession. It's also consistent with what economists have been picking up elsewhere: several analysts have already flagged that white-collar and professional-services hiring has been softening even as the broader labor market holds up, and the debate over how much of that is AI, and how much is simply a slower capital cycle, is far from settled among the executives at the companies making the cuts themselves.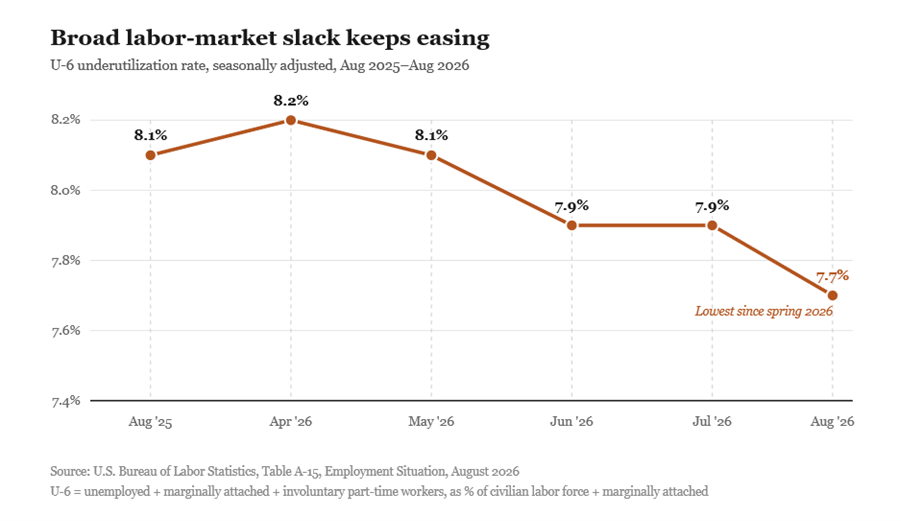
What this means for HR and talent leaders
None of this calls for panic, but it is a good prompt to look past the headline number when you're briefing your own leadership on what the labor market means for your hiring plans.
- Segment your workforce planning by occupation, not just industry. A services or retail-heavy employer might be hiring into a genuinely tight market for front-line roles at the same time its corporate and analytical functions face a softer one. Blending the two into a single "labor market" briefing for your executive team risks getting both halves wrong.
- Watch entry-level and mid-professional pipelines specifically. If the professional-occupation uptick continues over the next few reports, it's likely to show up first in longer time-to-fill for senior roles paired with a flooded applicant pool for junior ones — exactly the kind of "hollowing out" pattern several analysts have warned about as generative AI absorbs routine parts of office work.
- Don't over-read one month. BLS revises payroll figures for months after release — June and July's combined 55,000-job upward revision this month is a reminder of how much a single initial print can move. Track the trend across two or three releases before changing hiring or reskilling strategy.
- Reskilling conversations belong in the room now, not later. Whether August's uptick turns out to be AI, capital costs, or noise, the safest move for HR leaders overseeing professional and technical staff is the same one either way: get ahead of internal mobility and AI-fluency training before a soft occupational signal turns into a hard one.
The Employment Situation for September is due out on Oct. 2. If the professional-occupation unemployment rate keeps climbing while headline payrolls stay strong, that will be the report that turns a hint into a pattern.